|
Pfizer Inc
enterococcus-faecium-selective medium pfizer selective enterococcus agar plate Enterococcus Faecium Selective Medium Pfizer Selective Enterococcus Agar Plate, supplied by Pfizer Inc, used in various techniques. Bioz Stars score: 90/100, based on 1 PubMed citations. ZERO BIAS - scores, article reviews, protocol conditions and more https://www.bioz.com/result/enterococcus-faecium-selective medium pfizer selective enterococcus agar plate/product/Pfizer Inc Average 90 stars, based on 1 article reviews
enterococcus-faecium-selective medium pfizer selective enterococcus agar plate - by Bioz Stars,
2026-05
90/100 stars
|
Buy from Supplier |
|
HiMedia Laboratories
selective hicrometm enterococcus faecium agar plates himedia 1580  Selective Hicrometm Enterococcus Faecium Agar Plates Himedia 1580, supplied by HiMedia Laboratories, used in various techniques. Bioz Stars score: 90/100, based on 1 PubMed citations. ZERO BIAS - scores, article reviews, protocol conditions and more https://www.bioz.com/result/selective hicrometm enterococcus faecium agar plates himedia 1580/product/HiMedia Laboratories Average 90 stars, based on 1 article reviews
selective hicrometm enterococcus faecium agar plates himedia 1580 - by Bioz Stars,
2026-05
90/100 stars
|
Buy from Supplier |
|
HiMedia Laboratories
selective hicrome enterococcus faecium agar plates himedia 1580 Selective Hicrome Enterococcus Faecium Agar Plates Himedia 1580, supplied by HiMedia Laboratories, used in various techniques. Bioz Stars score: 90/100, based on 1 PubMed citations. ZERO BIAS - scores, article reviews, protocol conditions and more https://www.bioz.com/result/selective hicrome enterococcus faecium agar plates himedia 1580/product/HiMedia Laboratories Average 90 stars, based on 1 article reviews
selective hicrome enterococcus faecium agar plates himedia 1580 - by Bioz Stars,
2026-05
90/100 stars
|
Buy from Supplier |
|
Pfizer Inc
enterococcus selective agar plates  Enterococcus Selective Agar Plates, supplied by Pfizer Inc, used in various techniques. Bioz Stars score: 86/100, based on 1 PubMed citations. ZERO BIAS - scores, article reviews, protocol conditions and more https://www.bioz.com/result/enterococcus selective agar plates/product/Pfizer Inc Average 86 stars, based on 1 article reviews
enterococcus selective agar plates - by Bioz Stars,
2026-05
86/100 stars
|
Buy from Supplier |
Image Search Results
Journal: bioRxiv
Article Title: Secreted antigen A peptidoglycan hydrolase is essential for Enterococcus faecium cell separation and priming of immune checkpoint inhibitor cancer therapy
doi: 10.1101/2023.11.19.567738
Figure Lengend Snippet: a , Growth curves of E. faecium WT Com15, Δ sagA , and complementation strains with functional and nonfunctional sagA genes. b , DIC microscopy of wild-type E. faecium, ΔsagA and ΔsagA/ p sagA complemented strains. Scale bar = 5 µm. c , Transmission electron microscopy (TEM) of E. faecium WT Com15, ΔsagA , and ΔsagA/ p sagA complemented strains. Scale bar = 0.2 µm. d , ɑ-SagA Western Blot of E. faecium WT Com15, Δ sagA , and complementation strains with functional and nonfunctional sagA genes, on both whole cell lysate (pellets) and total secreted proteins (secreted).
Article Snippet: Fecal samples were weighed, resuspended in sterile PBS, homogenized by douncing with sterile pestles, serially diluted in sterile PBS, and then plated by drip assay onto selective
Techniques: Functional Assay, Microscopy, Transmission Assay, Electron Microscopy, Western Blot

Journal: bioRxiv
Article Title: Secreted antigen A peptidoglycan hydrolase is essential for Enterococcus faecium cell separation and priming of immune checkpoint inhibitor cancer therapy
doi: 10.1101/2023.11.19.567738
Figure Lengend Snippet: a , PCR validation of Δ sagA deletion. b , Δ sagA cells are sedimented at the bottom of the tube compared to E. faecium WT Com15 and Δ sagA / p sagA .
Article Snippet: Fecal samples were weighed, resuspended in sterile PBS, homogenized by douncing with sterile pestles, serially diluted in sterile PBS, and then plated by drip assay onto selective
Techniques: Biomarker Discovery

Journal: bioRxiv
Article Title: Secreted antigen A peptidoglycan hydrolase is essential for Enterococcus faecium cell separation and priming of immune checkpoint inhibitor cancer therapy
doi: 10.1101/2023.11.19.567738
Figure Lengend Snippet: a, Approximate MIC determinations via antibiotic test strips for E. faecium WT Com15, Δ sagA and Δ sagA / p sagA. b, Liquid culture MIC determination for ampicillin.
Article Snippet: Fecal samples were weighed, resuspended in sterile PBS, homogenized by douncing with sterile pestles, serially diluted in sterile PBS, and then plated by drip assay onto selective
Techniques:

Journal: bioRxiv
Article Title: Secreted antigen A peptidoglycan hydrolase is essential for Enterococcus faecium cell separation and priming of immune checkpoint inhibitor cancer therapy
doi: 10.1101/2023.11.19.567738
Figure Lengend Snippet: a , Representative cryo-ET images of E. faecium WT Com15, Δ sagA , and Δ sagA /p sagA are shown in the top row. The cell wall, septum, divisome, and ribosome are indicated by white arrows. 3D segmentations are shown in the bottom row. The cell wall is annotated in blue, the membrane in green, and the divisome in magenta. Scale bar = 100 nm. b , The upper panel shows a diagram illustrating how measurements are collected. In the lower panel, a representative cryo-ET image of the septum is shown. Scale bar = 50 nm. c , Comparison of cell wall thickness. The violin plot displays the distribution of cell wall thickness, with E. faecium WT Com15 WT (n=66) shown in blue, ΔsagA (n=96) shown in red, and ΔsagA / p sagA (n=69) shown in magenta. Black dotted lines represent median ( E. faecium WT Com15 WT: 47.48nm, ΔsagA : 50.11nm, ΔsagA / p sagA : 46.42nm) while the colored dotted lines represent quartiles. Welch’s t test was used to calculate statistical significance. ns, P ≥ 0.05. d , Comparison of septum thickness. The violin plot displays the distribution of septum thickness, with E. faecium WT Com15 WT (n=26) shown in blue, ΔsagA (n=62) shown in red, and ΔsagA /p sagA (n=16) shown in magenta. Black dotted lines represent median ( E. faecium WT Com15: 54.33nm, ΔsagA : 54.86nm, ΔsagA / p sagA : 57.50nm) while the colored dotted lines represent quartiles. Welch’s t test was used to calculate statistical significance. ns, P ≥ 0.05. ( e ) Comparison of divisome architecture. To assess potential alterations in the divisome architecture, the distance between the apical end of the septum and the membrane-proximal ring was divided by the distance between the apical end of the septum and the membrane-distal ring. The violin plot displays the distribution of the ratios, with E. faecium WT Com15 WT (n=31) shown in blue, ΔsagA (n=40) shown in red, and ΔsagA / p sagA (n=42) shown in magenta. Black dotted lines represent median ( E. faecium WT Com15: 0.5, ΔsagA : 0.5, ΔsagA / p sagA : 0.5) while the colored dotted lines represent quartiles. Welch’s t test was used to calculate statistical significance. ns, P ≥ 0.05.
Article Snippet: Fecal samples were weighed, resuspended in sterile PBS, homogenized by douncing with sterile pestles, serially diluted in sterile PBS, and then plated by drip assay onto selective
Techniques: Tomography, Membrane, Comparison
Journal: bioRxiv
Article Title: Secreted antigen A peptidoglycan hydrolase is essential for Enterococcus faecium cell separation and priming of immune checkpoint inhibitor cancer therapy
doi: 10.1101/2023.11.19.567738
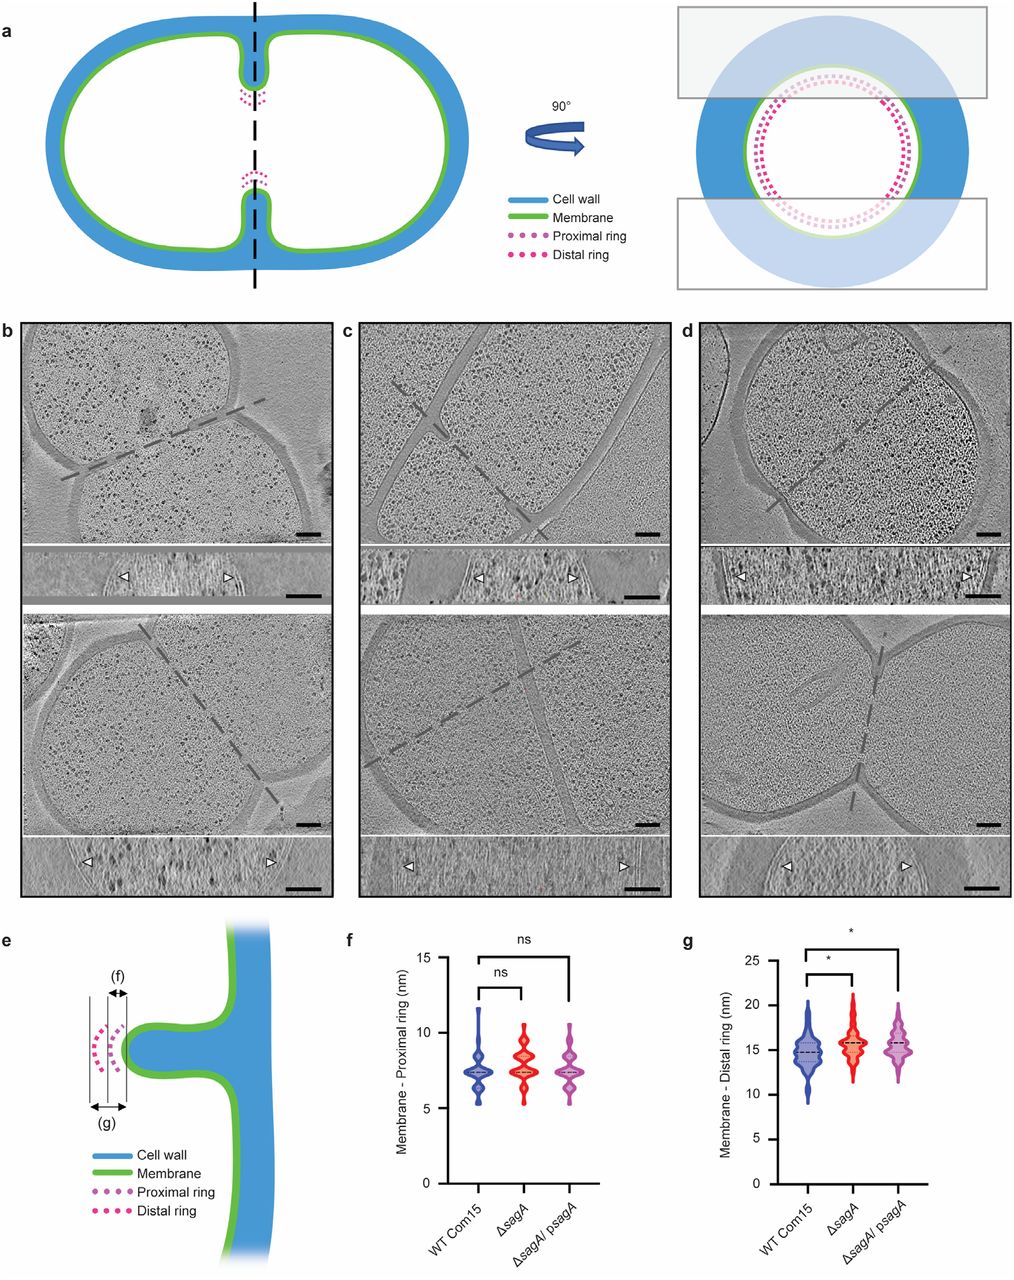
Figure Lengend Snippet: a , Cartoon model depicting cell division site in the xy coordinate plane (left) and xz coordinate plane (right). The two boxes shown in right represent the cryo-focused ion beam (cryo-FIB) milling patterns used to generate thin sections of E. faecium for subsequent cryo-electron tomography (cryo-ET) imaging. b-d , Representative tomographic slices of three E. faecium strains: E. faecium WT Com15 ( b ), Δ sagA ( c ), and Δ sagA / p sagA ( d ). The upper panels show view of dividing cells in the xy coordinate plane and, while the corresponding bottom panels show the divisome complex (annotated with white arrows) at the highlighted areas in the corresponding upper panels in the xz coordinate plane, obtained by rotating the cell 90° along the highlighted axis. Scale bar = 100 nm. e , A diagram indicating how measurements were collected. f , Comparison of membrane to proximal ring distance. The violin plot displays the distribution of distance between the apical end of septum membrane to the proximal ring, with E. faecium WT Com15 (n=31) shown in blue, ΔsagA (n=40) shown in red, and ΔsagA / p sagA (n=42) shown in magenta. Black dotted lines represent median ( E. faecium WT Com15: 7.39nm, ΔsagA : 7.39nm, ΔsagA / p sagA : 7.39nm) while the colored dotted lines represent quartiles. Welch’s t test was used to calculate statistical significance. ns, P ≥ 0.05. g , Comparison of membrane to distal ring distance. The violin plot displays the distribution of distance between the apical end of septum membrane to the distal ring, with E. faecium WT Com15 (n=31) shown in blue, ΔsagA (n=40) shown in red, and ΔsagA / p sagA (n=42) shown in magenta. Black dotted lines represent median ( E. faecium WT Com15: 14.77nm, ΔsagA : 15.83nm, ΔsagA / p sagA : 15.83nm) while the colored dotted lines represent quartiles. Welch’s t test was used to calculate statistical significance. *, P < 0.05.
Article Snippet: Fecal samples were weighed, resuspended in sterile PBS, homogenized by douncing with sterile pestles, serially diluted in sterile PBS, and then plated by drip assay onto selective
Techniques: Tomography, Imaging, Comparison, Membrane

Journal: bioRxiv
Article Title: Secreted antigen A peptidoglycan hydrolase is essential for Enterococcus faecium cell separation and priming of immune checkpoint inhibitor cancer therapy
doi: 10.1101/2023.11.19.567738
Figure Lengend Snippet: a - c , Representative tomographic slices of three E. faecium strains: E. faecium WT Com15 ( a ), Δ sagA ( b ), and Δ sagA /p sagA ( c ). Cell division septa are indicated by white arrows. Scale bar = 100 nm. d , A diagram indicating how septum angle measurements were collected. Acute angles are recorded for further analysis. e , Comparison of septum angle. The violin plot displays the distribution of septum angle, with E. faecium WT Com15 WT (n=40) shown in blue, ΔsagA (n=49) shown in red, and ΔsagA / p sagA (n=37) shown in magenta. Black dotted lines represent median ( E. faecium wt: 88°, ΔsagA : 79°, ΔsagA /p sagA : 87°) while the colored dotted lines represent quartiles. Welch’s t test was used to calculate statistical significance. *, P < 0.05; ****, P < 0.0001. f , Pairwise comparison of septum angle in opposing septa. The paired plot displays the distribution of septum angle, with E. faecium WT Com15 WT (n=18) shown in blue, ΔsagA (n=16) shown in red, and ΔsagA / p sagA (n=16) shown in magenta. Two septum angles from opposing septa are linked with straight lines. Paired t test was used to calculate statistical significance. ns, P ≥ 0.05.
Article Snippet: Fecal samples were weighed, resuspended in sterile PBS, homogenized by douncing with sterile pestles, serially diluted in sterile PBS, and then plated by drip assay onto selective
Techniques: Comparison

Journal: bioRxiv
Article Title: Secreted antigen A peptidoglycan hydrolase is essential for Enterococcus faecium cell separation and priming of immune checkpoint inhibitor cancer therapy
doi: 10.1101/2023.11.19.567738
Figure Lengend Snippet: a, LC-MS analysis of peptidoglycan isolated from E. faecium WT Com15 (top), Δ sagA (middle), and Δ sagA /p sagA (bottom). Numbers correspond to each muropeptide annotated in the table ( b ). b, Composition of muropeptides from E. faecium . a. Peak numbers refer to ( a ). b. GM, disaccharide (GlcNAc-MurNAc); 2GM, disaccharide-disaccharide (GlcNAc-MurNAc-GlcNAc-MurNAc); 3GM, disaccharide-disaccharide-disaccharide (GlcNAc-MurNAc-GlcNAc-MurNAc-GlcNAc-MurNAc); GM-Tri, disaccharide tripeptide (L-Ala-D-iGln-L-Lys); GM-Tetra, disaccharide tetrapeptide (L-Ala-D-iGln-L-Lys-D-Ala); GM-Penta, disaccharide pentapeptide (L-Ala-D-iGln-L-Lys-D-Ala -D-Ala). c. The assignment of the amide and the hydroxyl functions to either peptide stem is arbitrary.
Article Snippet: Fecal samples were weighed, resuspended in sterile PBS, homogenized by douncing with sterile pestles, serially diluted in sterile PBS, and then plated by drip assay onto selective
Techniques: Liquid Chromatography with Mass Spectroscopy, Isolation

Journal: bioRxiv
Article Title: Secreted antigen A peptidoglycan hydrolase is essential for Enterococcus faecium cell separation and priming of immune checkpoint inhibitor cancer therapy
doi: 10.1101/2023.11.19.567738
Figure Lengend Snippet: a , Relative abundance of muropeptides isolated from E. faecium strains (n=6). Data are presented as mean value ± standard deviation and analyzed with one-way ANOVA and Tukey’s multiple comparison post hoc test. *p≤0.05; **p≤0.01; ***p≤0.005; ****p≤0.001. Numbers correspond different muropeptides from LC-MS analysis listed in legend. b , Composition of muropeptides from E. faecium . a. Peak numbers refer to ( a ). b. GM, disaccharide (GlcNAc-MurNAc); 2GM, disaccharide-disaccharide (GlcNAc-MurNAc-GlcNAc-MurNAc); 3GM, disaccharide-disaccharide-disaccharide (GlcNAc-MurNAc-GlcNAc-MurNAc-GlcNAc-MurNAc); GM-Tri, disaccharide tripeptide (L-Ala-D-iGln-L-Lys); GM-Tetra, disaccharide tetrapeptide (L-Ala-D-iGln-L-Lys-D-Ala); GM-Penta, disaccharide pentapeptide (L-Ala-D-iGln-L-Lys-D-Ala -D-Ala). c. The assignment of the amide and the hydroxyl functions to either peptide stem is arbitrary. c, Relative abundance of GMDP from LC-MS chromatograms (n=6). d , NF-κB responses of HEK-Blue™ hNOD2 cells to live E. faecium strains (MOI=1). e , Colony forming units (CFU) of E. faecium strains (MOI = 1) internalized in HEK-Blue™ hNOD2 cells (n=6). Dashed line indicates Limit of Detection (LOD). Data are presented as mean value ± standard deviation and analyzed with one-way ANOVA and Tukey’s multiple comparison post hoc test. *p≤0.05; **p≤0.01; ***p≤0.005; ****p≤0.001; ns, not significant.
Article Snippet: Fecal samples were weighed, resuspended in sterile PBS, homogenized by douncing with sterile pestles, serially diluted in sterile PBS, and then plated by drip assay onto selective
Techniques: Isolation, Standard Deviation, Comparison, Liquid Chromatography with Mass Spectroscopy

Journal: bioRxiv
Article Title: Secreted antigen A peptidoglycan hydrolase is essential for Enterococcus faecium cell separation and priming of immune checkpoint inhibitor cancer therapy
doi: 10.1101/2023.11.19.567738
Figure Lengend Snippet: a, Schematic of tumor growth experiment: mice were provided water containing antibiotics for one week and started drinking bacteria three days before tumor implantation. Once the tumor reaches ∼100 mm 3 , the measurement starts and two days after treated with anti-PD-1 (MC38) or anti-PD-L1 (B16F10) every other day. b , MC-38 tumor growth in Nod2 +/- or Nod2 -/- mice that were colonized with E. faecium WT Com15 and treated with anti-PD-1 starting at day 7. n=10 for Nod2 +/- mice, n=6 for Nod2 -/- mice. c , B16F10 tumor growth in C57BL/6 mice that were colonized with E. faecium WT Com15 or ΔsagA and treated with anti-PD-L1 starting at day 6. No bacterial colonization group as a control (black). n=7-8 mice per group. d , Fecal CFU analysis of E. faecium on HiCrome plate from c at day 6. n=6 per group. Each dot represents one mouse. The line indicates the limit of detection (LOD, 4000 CFU g -1 ). Nd, not detected. Data represent means ± 95% confidence interval. e-j , Quantification of tumor infiltrating CD45 + cells ( e ), FoxP3 + cells ( f ), CD3 + CD8 + cells ( g ), GranzymeB + CD8 + T cells ( h ), Ki67 + CD8 + T cells ( i ) and PD-1 + CD8 + T cells ( j ). For f, h-j , fluorescence minus one (FMO) control was used to define gates. n=7 mice per group. Data for b and c represent mean ± SEM. And were analyzed using a mixed effects model with Tukey’s multiple comparisons post hoc test. Data for e-j represent mean ± SEM. And were analyzed by the Mann-Whitney U (one-tail) test. *P < 0.05, **P < 0.01, ***P < 0.001, ****P < 0.0001; ns, not significant.
Article Snippet: Fecal samples were weighed, resuspended in sterile PBS, homogenized by douncing with sterile pestles, serially diluted in sterile PBS, and then plated by drip assay onto selective
Techniques: Bacteria, Tumor Implantation, Control, Fluorescence, MANN-WHITNEY

Journal: bioRxiv
Article Title: Secreted antigen A peptidoglycan hydrolase is essential for Enterococcus faecium cell separation and priming of immune checkpoint inhibitor cancer therapy
doi: 10.1101/2023.11.19.567738
Figure Lengend Snippet: Deletion of sagA impairs peptidoglycan remodeling and cell separation in E. faecium and limits the activation of NOD2 in mammalian cells to promote immune checkpoint inhibitor cancer therapy in mouse models. Created with BioRender.com.
Article Snippet: Fecal samples were weighed, resuspended in sterile PBS, homogenized by douncing with sterile pestles, serially diluted in sterile PBS, and then plated by drip assay onto selective
Techniques: Activation Assay
Journal: Veterinary Sciences
Article Title: Isolation and Characterization of Vancomycin-Resistant Enterococcus faecium from Cattle: Antimicrobial Resistance, Virulence Genes, and Pathogenicity
doi: 10.3390/vetsci12090880
Figure Lengend Snippet: Identification and molecular characterization of E. faecium isolates. ( A ) Colony morphology on Enterococcus-selective agar showing brown-black colonies with brown halos. ( B ) Colony morphology on blood agar with small, round, slightly raised, grayish-white, translucent colonies. ( C ) Gram staining showing Gram-positive cocci, occurring singly or in pairs. ( D ) PCR amplification of the ddl gene showing a 176 bp product specific to E. faecium ; Lanes 1–3 in correspond to isolates SCQ3, SCQ4, and SCQ11, respectively. ( E ) 16S rRNA gene amplification producing an approximately 1500 bp band; Lanes 1–3 in correspond to isolates to SCQ3, SCQ4, and SCQ11, respectively. ( F ) Neighbor-joining phylogenetic tree constructed using MEGA X from aligned 16S rRNA sequences, illustrating genetic relationships between isolates and reference E. faecium strains from NCBI. Bootstrap values (n = 1000 replicates) shown at branches; scale bar indicates evolutionary distance.
Article Snippet: Cultures were then streaked onto Pfizer
Techniques: Staining, Amplification, Construct